Publish Date:
7 April 2025Keywords:
Declines in applications for emergency housing have increased from 2% in 2020 to 27% in recent data.
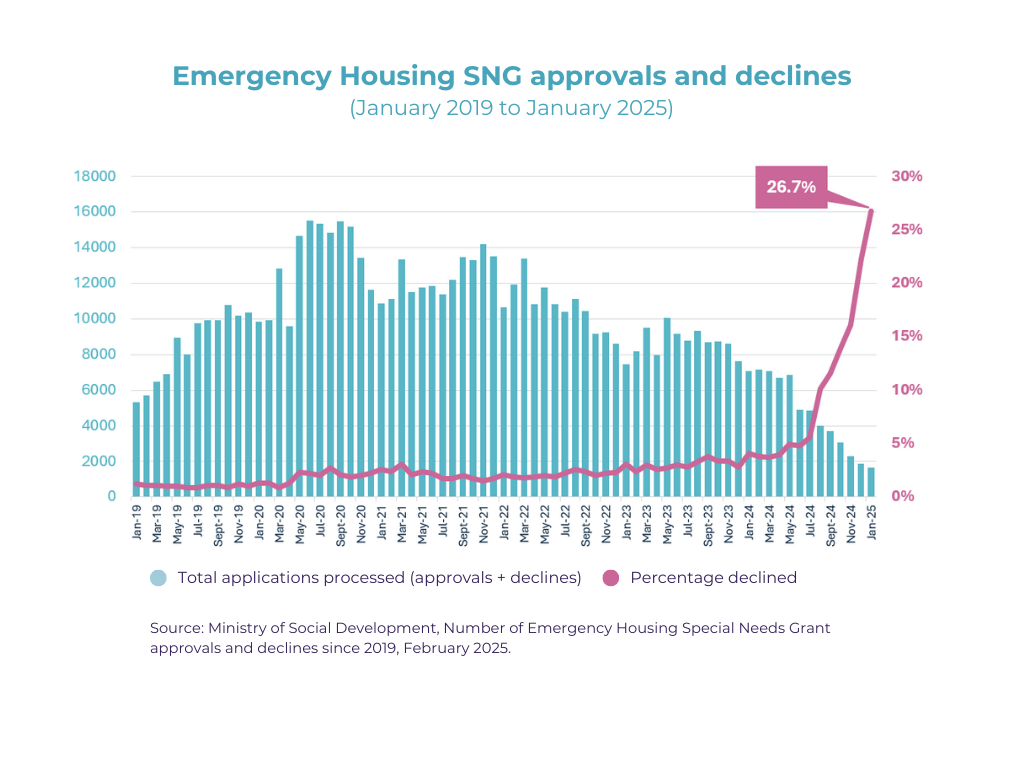
Note: Total applications processed is the total number of applications received by MSD in the given time period. Percentage declined is the percentage of these applications that were declined in a given time period.
The graph highlights that applications for housing in emergency circumstances have steadily trended downwards since the COVID-19 peak impact in 2020.
We acknowledge efforts to reduce reliance on emergency housing, particularly for families with children. At the same time, the increase in decline rates indicates that a growing number of people are not accessing housing support when they seek assistance.
The graph points to a sharp rise from July 2024 to January 2025, where decline rates grew five-fold from 6% up to 27%. That’s a 377% rate of increase! In the same period, the total number of applications reduced 66%.
This drop in applications may reflect a range of factors, including changes in demand, shifts in eligibility, or how people engage with the system.
Given reports from providers of increasing homelessness, these trends suggest that demand for housing support remains significant.
This raises an important question about where people are living when they are not accessing emergency housing support, and how their needs can be understood and responded to.
Data source: OIA data from Ministry of Social Development, supplied by NZCCSS and Otago University, EHSNG approvals and declines since 2019